A comparison of peer and faculty narrative feedback on medical student oral research presentations
Tracey A.H. Taylor and Stephanie M. Swanberg
Department of Foundational Medical Studies, Oakland University William Beaumont School of Medicine, Rochester, Michigan, USA
Submitted: 17/02/2020; Accepted: 18/09/2020; Published: 30/09/2020
Int J Med Educ. 2020; 11:222-229; doi: 10.5116/ijme.5f64.690b
© 2020 Tracey A.H. Taylor & Stephanie M. Swanberg. This is an Open Access article distributed under the terms of the Creative Commons Attribution License which permits unrestricted use of work provided the original work is properly cited. http://creativecommons.org/licenses/by/3.0
Abstract
Objectives: The purpose of this project was to evaluate and improve the oral presentation assessment component of a required research training curriculum at an undergraduate medical school by analyzing the quantity, quality, and variety of peer and faculty feedback on medical student oral research presentations.
Methods: We conducted a program evaluation of oral presentation assessments during the 2016 and 2017 academic years. Second-year medical students (n=225) provided oral presentations of their research and received narrative feedback from peers and faculty. All comments were inductively coded for themes and Chi-square testing compared faculty and peer feedback differences in quantity, quality, and variety, as well as changes in feedback between the initial and final presentations. Comparative analysis of student PowerPoint presentation files before and after receiving feedback was also conducted.
Results: Over two years, 2,617 peer and 498 faculty comments were collected and categorized into ten themes, with the top three being: presentation skills, visual presentation, and content. Both peers and judges favored providing positive over improvement comments, with peers tending to give richer feedback, but judges more diverse feedback. Nearly all presenters made some change from the initial to final presentations based on feedback.
Conclusions: Data from this analysis was used to restructure the oral presentation requirement for the students. Both peer and faculty formative feedback can contribute to developing medical student competence in providing feedback and delivering oral presentations. Future studies could assess student perceptions of this assessment to determine its value in developing communication skills.
Introduction
The development of effective communication skills, including providing feedback and giving oral presentations, tends to be challenging for students to master. Many health professions education accreditation bodies worldwide require students to be involved in research and to receive timely formative feedback. Research curricula provide an ideal opportunity for students to practice oral presentations and accrediting bodies in the United States and Canada, including medicine, nursing, physical therapy, occupational therapy, and nutrition, require or encourage student involvement in research (Table 1).1-5 Furthermore, accreditation standards for medicine, physical therapy, and occupational therapy education programs in the United States and Canada require that students receive formative feedback. For example, the Liaison Committee on Medical Education (LCME) requires that all medical students receive formal formative feedback in each course or clerkship (Standard 9.7).5 The Commission on Accreditation in Physical Therapy Education (CAPTE) requires that physical therapy students receive supervision and feedback during their clinical education (Standard 4J)4 and the Accreditation Council for Occupational Therapy Education (ACOTE) requires that all occupational therapy students are evaluated and provided feedback in a timely fashion (Standard A.3.5).2 Previous studies have found that timely formative feedback on oral presentations has been shown to improve student competence in oral presentations.6-9
In courses, clerkships, or clinical education experiences where research is a component, formative peer feedback can be used to satisfy feedback standards, especially where feedback is otherwise difficult to provide. In the undergraduate literature, use of peer feedback on oral presentations has been reported in a variety of disciplines including the sciences6,10,11 business,12 engineering,13 and health sciences (nursing, nutrition, midwifery, and therapeutics).7,14,15 In undergraduate medical education (UGME), peer feedback has traditionally been used in the anatomy laboratory16,17 problem-based learning (PBL) activities,18-20team-based learning (TBL) activities21objective structured clinical examinations (OSCE),22-24and oral clinical case presentations.8,25 Formal education in developing and delivering oral research presentations provides a unique approach for improving student oral presentation competence. By learning to provide feedback, as well as doing oral presentations, medical students are introduced into the community of practice of medicine.
At Oakland University William Beaumont School of Medicine (OUWB), the Embark Program is a required, longitudinal scholarly concentration program spanning the four years of medical school.26 In this program, all medical students develop, conduct, and report on an independent, faculty-mentored research project meant to foster the development of four professional skills: team communication, research design, project operationalization, and time management.26 Following the first year of coursework in research design and project management, second-year medical students are taught research communication techniques including academic writing, drafting a scientific abstract,27 developing posters and oral presentations,28 and strategies for publishing. Specifically, students learn best practices for creating and delivering a five-minute oral presentation introducing their research and are assessed on their presentation skills by both peers and faculty.
In order to explore the natural teaching and learning environment and minimize researcher bias, no hypotheses were generated prior to initiation of this study. The aim of this project was to describe the quantity, quality, and variety of peer and faculty judge narrative feedback on medical student oral research presentations. An additional goal was to examine if and how students acted on this oral presentation feedback for a future research presentation in the same year. To our knowledge, previous studies have not reported analyzing peer feedback for medical student research presentations nor investigated differences in peer and faculty feedback on oral research presentations. Though focused on medical education, the findings of this project can be used to strategically strengthen the research curricula in other health professional education programs.
Methods
A program evaluation of the oral research presentation component of the second-year Embark courses, “Techniques in Effective Scholarly Presentation” (winter semester) and “Embark Research Colloquium” (spring semester) was conducted.
Participants
The Oakland University IRB determined that this project does not meet the definition of research under the purview of the IRB according to federal regulations. More specifically, this project was determined to be program evaluation.
All second-year medical students (n=98 in 2016; n=127 in 2017) were required to present a mandatory “status update” oral presentation of their research during the winter semester (the “initial presentation”; see Figure 1). Students were provided with instruction as well as a PowerPoint template guide and divided into groups of 12-13 student presenters. They were allotted five minutes to present plus four minutes for questions from student and faculty attendees. A second requirement for each student was to provide narrative feedback to five assigned student peers during the presentations. All medical students are trained in providing narrative feedback to their peers during orientation in the first year of medical school, as well as assessed on the quality of their feedback during their first two years. The feedback consisted of three open-ended questions:
· Briefly describe 1-2 things that were done well during this oral presentation (referred to as “done well”)
· Briefly describe 1-2 things that could be improved in this oral presentation, and describe how improvement could be achieved (referred to as “improve”)
· Any additional comments can be written here (optional)
In addition, each presentation was judged by a panel of at least four faculty judges. Judges were provided with a scoring rubric and offered optional training but were neither instructed in nor specifically encouraged to provide narrative feedback. All judges scored each presentation using the rubric and could opt to give narrative feedback.
The highest ranked students (n=15 in 2016; n=9 in 2017), as determined by normalized and pooled judge scores, were invited to present their research a second time (termed the “final presentation”; Figure 1) in the spring semester course. As students were not considered evaluators, peer feedback was not used in selecting the final group of presenters. A key spring course requirement was to present a research presentation (if chosen) or to provide narrative feedback to three or four student peers using the same three questions. Each presentation was again allotted five minutes plus four minutes for questions. Student presentations were again ranked and scored by faculty judges (n=14 in 2016; n=5 in 2017) using the rubric and the top three students were awarded the “Dean’s Choice Award” along with a monetary prize.
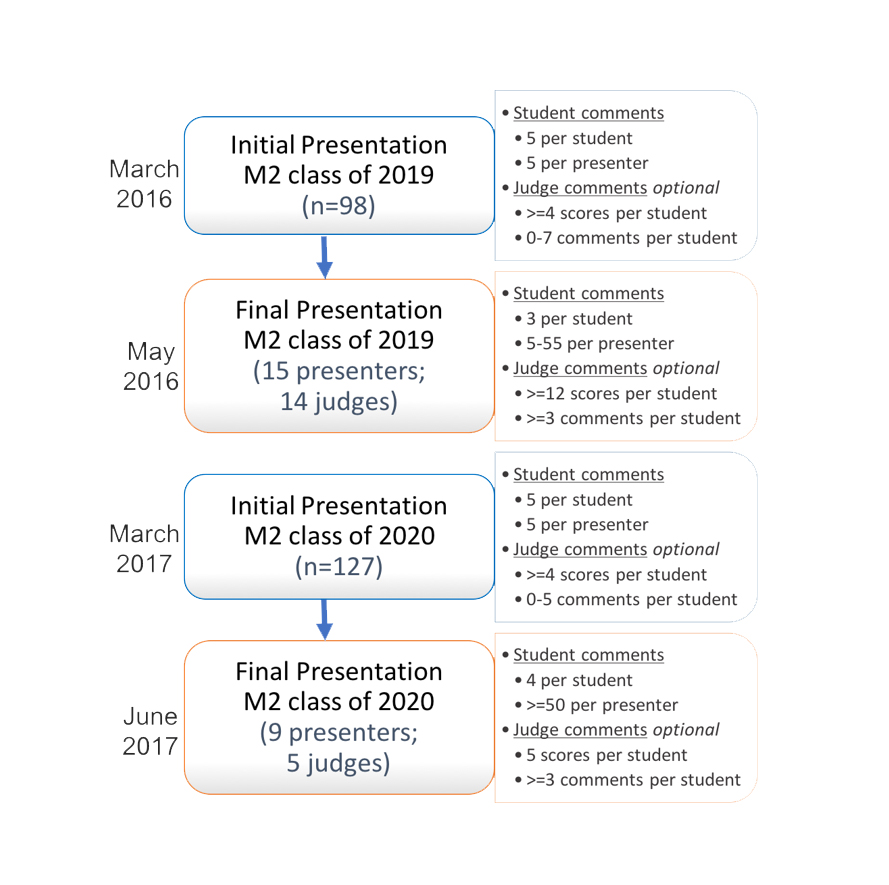
Figure 1
Flow diagram of medical student research oral presentations over two yearsData analysis
All data (peer feedback, judge feedback, and student PowerPoint files) collected were de-identified and randomly assigned a subject identification number prior to analysis. Many of the collected peer and judge feedback comments contained more than one “thought”, and so those were separated prior to analysis. Multiple methods (qualitative and quantitative) were used to analyze the data. Thematic analysis of each comment from peers and faculty over the two years was conducted using inductive coding.29 In this method, themes emerge through an iterative process of reading and re-reading the data. This open coding was carried out independently by the two authors, followed by review, discussion, and revision of identified themes. Following this, a coding template was created using the identified themes and all comments were coded independently. At that point, any differences in coding were discussed and resolved. In addition to the qualitative analysis, frequency counts for each theme were calculated by totaling the coded comments in each category. Chi-square testing was used to compare changes in theme frequency between the initial and final presentations and between faculty and peer feedback. A p-value of <0.05 was considered statistically significant but was modified to consider the effect of clustering of comments for each student, when applicable. All analysis was done in SAS 9.4 (SAS Institute Inc., Cary, NC, USA).
Comparative analysis of student PowerPoint files from the two courses (before and after receiving initial presentation feedback) was conducted using the files from students that presented in both courses. Specifically, any changes in the design of the PowerPoint was noted including text, font size or style, background style, colors, graphics, and the notes field.
Results
Quantity of feedback
Overall, 3,115 narrative comments were collected from peers (n=2,617) and judges (n=498) over two years. Ten themes emerged which were lettered from A-to-I and NM (“No Meat”: comments that did not contain substantial content such as “good job” and “great presentation.”). The themes that were most prevalent were Content (E) and Presentation Skills (B), at frequencies of 29.6% (n=921) and 26.4% (n=822), respectively. In 2016, comments regarding Presentation Skills (B) were most frequent at 31.3% (n=396) followed by Content (E) at 24.3% (n=308), whereas in 2017 it was reversed with Content (E) at 33.1% (n=613) and Presentation Skills (B) at 23% (n=426). Comments in Visual Presentation (C) were the third most prevalent in both years (19.3% in total; 16.9% (n=214) in 2016; 20.9% (n=387) in 2017). The least frequent theme was Progress on Project (G) at only 0.2% over both years (0.3% (n=4) in 2016; 0.1% (n=2) in 2017). When comparing peer to judge feedback over both years, peer comments greatly outweighed judge comments in sheer number (Table 2). In 2016, peers provided a total of 937 comments while judges provided 328. The difference increased in 2017 with peers giving 1,680 total comments and judges only 170.
Variety of feedback
Of the 2,617 peer comments over two years, 65.5% (n=1,713) described aspects of the presentations done well, with 34.5% (n=904) describing improvement suggestions. The majority of done well and improve comments were in the same three categories in both the initial and final presentations in both years: Content (E), Presentation Skills (B), and Visual Presentation (C).
Of the 498 comments from judges over two years, 64.5% (n=321) described what students did well while 35.5% (n=177) focused on improvement. Unlike students, the most frequently commented on categories by judges shifted between the two years: Presentation Skills (B; 30.8%; n=101), Content (E; 20.1%; n=66), and Visual Presentation (C; 17.4%; n=57) in 2016, and Content (E; 33.5%; n=57), No Meat (NM; 20.6%; n=35), Visual Presentation (C; 14.7%; n=25) and Presentation Skills (B; 14.1%; n=24) in 2017.
When reviewing all comments, peers and judges prioritized different categories when giving feedback. In 2016, judges commented significantly more than peers on the presenter’s Knowledge of Topic (D; 10% (n=54) of comments for judges versus 5.3% (n=33) for peers (χ2 (1, N = 830) = 5.52, p=0.03) and Answering Questions (I; 6.6% (n=14) for judges versus 4.2% (n=26) for peers) (χ2 (1, N = 830) = 2.03, p=0.02) when describing what was done well, while peers commented significantly more than judges on Content (E; 22.8% (n=141) for peers versus 15.2% (n=32) for judges) (χ2 (1, N = 830) = 5.53, p=0.0002). In 2017, the differences between peer and judge comment categories were even more pronounced. When discussing what was done well, judges provided significantly fewer comments than peers related to Presentation Skills (B; 14.5% (n=16) for judges versus 22.4% (n=245) for peers) (χ2 (1, N = 1204) = 3.63, p=0.04) and Content (E; 15.5% (n=17) for judges versus 30.6% (n=335) for peers) (χ2 (1, N = 1204) = 11.11, p=0.01). The only category in which judges provided significantly more feedback on what was done well was No Meat (NM) at 31.8% (n=35) of comments versus only 7.9% (n=86) of peers (χ2 (1, N = 1204) = 63.46, p=0.0001). When providing feedback on what could be improved, judges commented significantly more on Content (E) (χ2 (1, N= 646) = 18.95, p=0.0001) with 66.7% (n=40) of comments versus only 37.7% (n=221) of peer comments and Study Design (F) with 3.3% (n=2) of comments compared to only 0.3% (n=2) of peer comments (χ2 (1, N = 646) = 7.92, p=0.02). However, peers focused significantly more on Presentation Skills (B) with 26.8% (n=157) of comments versus only 13.3% (n=8) of judge comments (χ2 (1, N = 646) = 5.18, p=0.01) and Visual Presentation (C) with 25.9% (n=152) of comments compared to only 10% (n=6) of judge comments (χ2 (1, N = 646) = 7.48, p=0.001). In general, judge feedback tended to be more diverse in scope providing comments in all categories. In fact, in both years, judges commented in all categories except for Progress on Project (G) related to what the presenters did well and Knowledge of Topic (D) for what they could improve.
Comparison of initial and final presentation feedback
When comparing initial and final presentation feedback, interesting differences between judge and peer comments emerged. In relation to how categories significantly decreased over the two years, in the initial presentations in 2017, judge improve comments decreased for both Presentation Skills (B; 37.5% (n=6) to 4.5% (n=2); (χ2 (1, N=60) = 11.03, p=0.0001) and Visual Presentation (C; 18.8% (n=3) to 6.8% (n=3); (χ2 (1, N=60) = 1.86, p=0.03). The trend was similar in 2016 with a significant decrease (χ2 (1, N=117) = 2.80, p=0.01) in the number of judge improve comments related to Visual Presentation (C) from 26.4% (n=14) in the initial presentation to 14.1% (n=9) in the final presentation. In 2016, there was a significant decrease (χ2 (1, N = 211) = 3.31, p=0.05) in the number of No Meat (NM) comments from judges from the initial 13.5% (n=15) to final presentations 6% (n=6) related to what students did well. For students, there was no statistically significant decrease in feedback from the initial to the final presentations in any category.
In contrast, many categories saw an increase from the initial to the final presentations, most related to done well comments. Judge comments in 2017 on Content (E) significantly increased from 7% (n=4) to 24.5% (n=13) of comments (χ2 (1, N=110) = 6.45, p=0.01) when discussing aspects of the presentation done well, but, surprisingly, also increased for student improvement (31.3% (n=5) to 79.5% (n=35); (χ2 (1, N = 60)=12.32, p=0.0001). In terms of peer comments of presentation aspects done well during the first year, there were significantly more related to Interest/Relevance to the Field (H) during the final presentations with 8.9% (n=41) compared to only 1.9% (n=3) in the initial presentations (χ2 (1, N=619)=8.61, p=0.0001). In both years, students commented significantly more frequently that presenters answered questions well (I) in the final presentations with 5% (n=23) in 2016 and 5.4% (n=53) in 2017 of comments respectively when compared to the initial presentations with only 1.9% (n=3 in 2016; n=2 in 2017) for each year (χ2 (1, N = 619) = 2.74, p=0.01 in 2016; χ2 (1, N=1094)=2.42, p=0.03 in 2017). No Meat (NM) comments from both peers and judges related to presentation aspects that presenters did well were overall more frequent in the final presentations: during the second year, there were 8.3% (n=82) NM peer comments in the final presentations compared to only 3.8% (n=4) (χ2 (1, N = 1094)=2.71, p=0.01) in the initial presentations and 39.6% (n=21) of the final presentation judge comments compared to 24.6% (n=14) of initial presentation comments (χ2 (1, N = 110) = 2.87, p=0.03).
Comparison of presentation file changes by individual students
In addition to reviewing narrative feedback, individual student presentation PowerPoint files were analyzed. Because analysis relied on the collection of written feedback comments from both student peers and faculty judges, it was possible to make qualitative individual student comparisons between the initial and final presentations. This analysis yielded a plethora of data for the 24 students.
Comparison of PowerPoint file changes made by students from the initial to the final presentations in each year revealed some interesting observations. In 2016, three of the 15 (20%) student presenters chose to make no changes to their presentation files; four students (26.7%) made small modifications (such as changing one single word in the entire file); and six (40%) made moderate changes (such as one large change that affected multiple slides in addition to modifying wording on two others). Two of the 15 (13.3%) students made large changes such as changing the background, changing the slide order, adding graphics, removing significant text, and/or adding emphasis to aspects of the slides. In 2017, only one of the nine students (11.1%) did not make changes to the presentation file (decrease over the previous year); four students (44.4%) made small changes (increase over the previous year); and two students each made moderate changes (22.2%; decrease over the previous year) and large changes (22.2%; increase over the previous year).
Discussion
The major finding of this study was that formative feedback from peers and faculty judges on oral presentation skills differs substantially in quantity, quality, and variety. Additionally, fewer students than expected utilized this feedback to improve their presentations for a future oral presentation. As this data was collected from an active course rather than a controlled study environment, judge and student feedback may more accurately reflect experiences and observations of the natural teaching and learning environment. To the authors’ knowledge, this is the first evaluation that analyses trends in peer and faculty feedback of medical student oral research presentations over time.
Impact of instruction & feedback on oral presentation skills
Several studies have shown that instruction in oral presentation skills followed by practice and feedback improve students’ ability to design and deliver effective presentations in both medical education8,9,25,30 and higher education settings.7,31 For example, one study designed an online clinical reasoning curriculum for second-year medical students, which included modules on oral presentation skills. The authors assessed the intervention groups’ presentations over three time points and their scores improved while the control group scores declined.8 Another study assessed the use of formative feedback from faculty on third-year medical student oral clinical case presentations during a pediatric clerkship and found similar improvements.30 This previous research supports the importance of integrating required instruction in oral presentation development and delivery into the OUWB Embark Program. The four professional skills developed through Embark: team communication, research design, project operationalization, and time management are essential lifelong skills that medical students can translate to their future clinical, academic, and research practices.26
Multi-source feedback
It is important to teach medical students how to design and deliver oral presentations as well as to include various sources of assessment when evaluating student performance. The positive impact of multiple sources of feedback specifically related to oral presentation skills has been well studied in higher education literature.24,31-34Our analysis discovered substantial differences in the quantity, variety, and quality of narrative feedback by peers and faculty.
Quantity of feedback
The sheer quantity of narrative comments given by peers and faculty judges varied dramatically with peers providing 2,617 comments over the two years and judges only providing 498 comments. This difference is primarily a result of how the feedback process was structured within the course (Figure 1). For the initial presentations, each presenter received feedback from five peers and four or more judges. For the final research presentations in 2016, students were required to select at least three of the 15 finalists in which to provide narrative feedback. Therefore, all 83 non-presenting students provided feedback with only fourteen judges providing scores for the 15 finalists. As students tended to provide feedback to the same students (the earlier presentations in the colloquium), the process was modified the following year. In 2017, students were assigned four peers to ensure that all student presenters received equal feedback during the final presentations. Judge narrative feedback was optional and each student received between zero and seven judge comments. Over the two years, the number of judges present at both the initial and final presentation sessions varied. The difference in quantity of feedback could dramatically affect the quality, as discussed later.
Variety of feedback
In regard to type of feedback provided, our analysis found that both faculty and peers mostly commented in the same three categories: Visual Presentation (C), Content (E), and Presentation Skills (B) (Table 2). However, faculty feedback was much more varied, leading to the development of new themes in our analysis: Knowledge of Topic (D), Study Design (F), Project Progress (G), Relevance to the Field (H), and Answering Questions (I). This difference in breadth of feedback between peers and faculty may simply be due to faculty’s previous experience in conducting research and delivering oral presentations. Indeed, faculty’s tacit knowledge and experience has been identified in previous studies as a major factor in differences between self, peer, and/or faculty feedback.32,33 As Magin and Helmore33 said:
“teachers are more experienced, more expert, and are less likely to be biased in their judgements.”
The variety of themes identified in our analysis (Table 2) are somewhat different from previously published studies. Many oral presentation rubrics published in the literature focus ondelivery, presentation content, and visual presentation.7,12,32,35 For example, De Grez and colleagues32 divided oral presentation elements into two categories: delivery (eye contact, vocal delivery, enthusiasm, interaction with audience, body language) and content (quality of introduction, structure, conclusion, professionalism). In these areas, our study found similar trends for peer and judge feedback. Previous medical education literature has focused on students’ ability to deliver an oral clinical case presentation, where elements related to gathering a patient history and physical exam findings are included.25,36,37 But the themes identified through our analysis reflect the elements unique to research presentations: Study Design (F), Project Progress (G), and Relevance to the Field (H), all important concepts for students in health sciences fields to learn as part of research training curricula.
Quality of feedback
Our analysis also revealed that the quality of student and faculty feedback differed substantially. Both peers and judges tended to be positive, providing twice as many done well comments as improve comments. In addition, judge feedback shifted to be more general from 2016 to 2017 with the number of done well comments in the No Meat (NM) category rising from 10.0% (n=21) in 2016 to a surprising 31.8% (n=35) in 2017 (χ2 (1, N=321)=24.00, p=0.0001). This differs from previously reported literature where faculty tend to judge students more critically than peers in oral presentation skills.31-33In the study by De Grez and colleagues,32 faculty scores were significantly lower than both peer- and self-assessments.32 However, in a study by Wettergreen and colleagues,34 comparisons of faculty and self-assessment scores of pharmacy students’ performance in clinical case discussions were found to be similar, which more closely mirrors our findings. Some of this difference may be due to the narrative prompts given to students but not to judges in our process. Students were required to comment on one thing the presenter did well and one area for improvement whereas judges were given an optional comment box with no prompt. Furthermore, our medical students are trained and assessed in providing both positive and constructive narrative feedback to their peers based on recommendations by Michaelsen and Schultheiss38 as part of TBL orientation in the first year of medical school. For our oral presentations, judges were offered training for the scoring rubric, but were neither instructed in nor specifically encouraged to provide narrative feedback to the student presenters. This could potentially be remedied in the future if judges are given the same two prompts and required to provide narrative comments to students in addition to quantitative scores using the rubric.
Trends in feedback between initial & final presentations
In comparing student presentation skills over time, our analysis shows that both peer and judge comments shifted between the initial and final presentations implying that the feedback on initial presentations was utilized by students to alter their final presentations. For example, in 2016, there were significantly more peer done well comments in Interest/Relevance to the Field (H) during the final presentations (8.9%; n=41) when compared with the initial presentations (1.9%; n=3) (χ2 (1, N= 619) = 8.61, p=0.0001), suggesting that revisions to the presentations spurred an increased interest of the research topic. Students also commented significantly more frequently that their peers answered questions well (I) in the final presentations (5%; n=23) when compared to the initial presentations (1.9%;n=3) (χ2 (1,N=619)=2.74, p=0.01), suggesting that student presenters answered questions more effectively with practice and preparation. That same year, judge improve comments related to Visual Presentation (C) saw a significant decrease (χ2 (1, N=117) = 2.80, p=0.01) from 26.4% (n=14) in the initial to 14.1% (n=9) in the final presentation. These findings suggest that students used both peer and judge formative feedback to revise the content or delivery from one presentation to the next. Indeed, two representative students did make changes to their presentations suggested by the feedback. It is interesting that even though the second representative student made the changes suggested by peers (darker background to slides), in the final presentation many peers commented that they would have preferred the initial color scheme (lighter background to slides). It was surprising that more students did not choose to utilize the feedback for substantial changes to their PowerPoints. This could be due to the fact that dedicated preparation time for medical school licensure examinations was scheduled immediately prior to the final presentations.
Limitations and future directions
This study has some limitations. First, as the original intent of this analysis was to examine the differences between peer and faculty feedback in oral presentation performance as part of the course, this was not designed as a research study. It is difficult to directly assess the impact, value, and student use of feedback in developing and delivering oral presentations. Our assumptions of value are based on student changes to their presentations and trends in peer and faculty feedback between the initial and final presentations. Future research studies could employ other methods of assessment such as critically analyzing video recordings of student presentations or assessing changes in the quantitative scores of judges from the initial to the final student presentations. Other studies could include surveying medical students to assess changes in attitudes and perceived value of the activity prior to and following the oral presentation component.
Second, this project likely includes selection bias as only feedback from the top students were analyzed rather than comments for the entire class. However, as no new themes emerged after analyzing the data over two years, we believe the data are representative.
Though not a limitation, direct comparisons of student and judge comments were a challenge based on several confounding factors. As mentioned previously, because the oral presentation activity was integrated into the curriculum, students were required to provide one positive comment and one area for improvement to a defined number of peers as a course requirement. Judges, on the other hand, served as volunteers and expectations regarding narrative feedback were not explicit. The scoring form included quantitative items with an optional and open-ended comments box for judges to provide feedback. In addition, because medical students were formally trained in giving narrative feedback for TBL and judges were not trained or coached, this may have affected the quantity and quality of peer versus judge feedback.
Conclusions
Our program evaluation analysis led to several changes in the oral presentation component of the courses from 2016 to 2017 including contributing to the development of a new rubric based on themes identified, revising the requirements for peer feedback to more evenly distribute comments across the student finalists, and encouraging judges to provide narrative feedback in 2017. Developing effective communication skills, whether in the context of clinical care or for research purposes, is an essential skill for all medical students as they enter the community of practice of medicine. Key components of communication are the abilities to give feedback as well as deliver oral presentations, though medical schools have focused much of their curricula on clinical case presentation skills. Students who learn how to effectively conduct and communicate research should be better prepared to practice evidence-based medicine in their future medical practice. The educational method described herein could be easily adapted and implemented at other health care educational institutions worldwide that include a scholarly concentration or research component in the curriculum. This analysis provides the groundwork for further investigation of the impact of both peer and faculty feedback on developing medical student oral presentation competence.
Acknowledgements
The authors wish to thank Patrick Karabon, MS, for his assistance with statistical analysis. We wish to thank Drs. Stefanie Attardi, PhD and Stephen Loftus, PhD for critically reviewing the manuscript. We also wish to thank Keith Engwall, MS LIS, for his role as the chair of the M2 Embark Presentation Committee and Stephen Loftus, PhD for his role as Embark co-course director for the second-year courses. We are grateful to Dwayne Baxa, PhD and Kara Sawarynski, PhD for their leadership as the Directors of the Embark Program, and Julie Strong who serves as the Embark course coordinator.
Conflict of Interest
The authors declare that they have no conflict of interest.
References
- Accreditation Council for Education in Nutrition and Dietetics. Accreditation standards for nutrition and dietetics coordinated programs, 2017. [Cited 21 Jan 2020]; Available from: https://www.eatrightpro.org/acend/accreditation-standards-fees-and-policies/2017-standards.
- Accreditation Council for Occupational Therapy Education. Accreditation Council for Occupational Therapy Education standards and interpretive guide, 2018. [Cited 21 Jan 2020]; Available from: https://acoteonline.org/accreditation-explained/standards/.
- American Association of Colleges of Nursing. The essentials of baccalaureate education for professional nursing practice, 2008. [Cited 21 Jan 2020]; Available from: https://www.aacnnursing.org/Education-Resources/AACN-Essentials.
- Commission on Accreditation in Physical Therapy Education. Standards and required elements for accreditation of physical therapist education programs, 2016. [Cited 21 Jan 2020]; Available from: http://www.capteonline.org/accreditationhandbook/.
- Liaison Committee on Medical Education. Functions and structure of a medical school: standards for accreditation of medical education programs leading to the MD degree, 2020. [Cited 21 Jan 2020]; Available from: http://lcme.org/publications/.
- Colthorpe K, Chen X, Zimbardi K. Peer feedback enhances a journal club for undergraduate science students that develops oral communication and critical evaluation skills. Journal of Learning Design. 2014;7(2):105–119.
- Gonyeau MJ, Trujillo J and DiVall M. Development of progressive oral presentations in a therapeutics course series. Am J Pharm Educ. 2006; 70: 36.
Full Text PubMed - Heiman HL, Uchida T, Adams C, Butter J, Cohen E, Persell SD, Pribaz P, McGaghie WC and Martin GJ. E-learning and deliberate practice for oral case presentation skills: a randomized trial. Med Teach. 2012; 34: 820-826.
Full Text PubMed - Park KH and Park IeB. The development and effects of a presentation skill improvement program for medical school students. Korean J Med Educ. 2011; 23: 285-293.
Full Text PubMed - Aryadoust V. Self- and peer assessments of oral presentations by first-year university students. Educational Assessment. 2015; 20: 199-225.
Full Text - Verkade H, Bryson-Richardson RJ. Student acceptance and application of peer assessment in a final year genetics undergraduate oral presentation. Journal of Peer Learning. 2013;6:1-18.
- Campbell KS, Mothersbaugh DL, Brammer C and Taylor T. Peer versus Self Assessment of Oral Business Presentation Performance. Business Communication Quarterly. 2001; 64: 23-40.
Full Text - Kim HS. Uncertainty analysis for peer assessment: oral presentation skills for final year project. European Journal of Engineering Education. 2014; 39: 68-83.
Full Text - Ohaja M, Dunlea M and Muldoon K. Group marking and peer assessment during a group poster presentation: the experiences and views of midwifery students. Nurse Educ Pract. 2013; 13: 466-470.
Full Text PubMed - Reitmeier CA and Vrchota DA. Self-assessment of oral communication presentations in food science and nutrition. Journal of Food Science Education. 2009; 8: 88-92.
Full Text - Camp CL, Gregory JK, Lachman N, Chen LP, Juskewitch JE and Pawlina W. Comparative efficacy of group and individual feedback in gross anatomy for promoting medical student professionalism. Anat Sci Educ. 2010; 3: 64-72.
Full Text PubMed - Spandorfer J, Puklus T, Rose V, Vahedi M, Collins L, Giordano C, Schmidt R and Braster C. Peer assessment among first year medical students in anatomy. Anat Sci Educ. 2014; 7: 144-152.
Full Text PubMed - Dannefer EF and Prayson RA. Supporting students in self-regulation: use of formative feedback and portfolios in a problem-based learning setting. Med Teach. 2013; 35: 655-660.
Full Text PubMed - Kamp RJ, van Berkel HJ, Popeijus HE, Leppink J, Schmidt HG and Dolmans DH. Midterm peer feedback in problem-based learning groups: the effect on individual contributions and achievement. Adv Health Sci Educ Theory Pract. 2014; 19: 53-69.
Full Text PubMed - Kamp RJ, Dolmans DH, Van Berkel HJ and Schmidt HG. The effect of midterm peer feedback on student functioning in problem-based tutorials. Adv Health Sci Educ Theory Pract. 2013; 18: 199-213.
Full Text PubMed - Emke AR, Cheng S, Dufault C, Cianciolo AT, Musick D, Richards B and Violato C. Developing professionalism via multisource feedback in team-based learning. Teach Learn Med. 2015; 27: 362-365.
Full Text PubMed - Burgess AW, Roberts C, Black KI and Mellis C. Senior medical student perceived ability and experience in giving peer feedback in formative long case examinations. BMC Med Educ. 2013; 13: 79.
Full Text PubMed - Chou CL, Masters DE, Chang A, Kruidering M and Hauer KE. Effects of longitudinal small-group learning on delivery and receipt of communication skills feedback. Med Educ. 2013; 47: 1073-1079.
Full Text PubMed - Inayah AT, Anwer LA, Shareef MA, Nurhussen A, Alkabbani HM, Alzahrani AA, Obad AS, Zafar M and Afsar NA. Objectivity in subjectivity: do students' self and peer assessments correlate with examiners' subjective and objective assessment in clinical skills? A prospective study. BMJ Open. 2017; 7: 012289.
Full Text PubMed - Williams DE and Surakanti S. Developing oral case presentation skills: peer and self-evaluations as instructional tools. Ochsner J. 2016; 16: 65-69.
PubMed - Sawarynski KE, Baxa DM and Folberg R. Embarking on a journey of discovery: developing transitional skill sets through a scholarly concentration program. Teach Learn Med. 2019; 31: 195-206.
Full Text PubMed - Swanberg S and Dereski M. Structured abstracts: best practices in writing and reviewing abstracts for publication and presentation. MedEdPORTAL. 2014; 10: mep_2374-8265.9908.
Full Text - Dereski M and Engwall K. Tips for effectively presenting your research via slide presentation. MedEdPORTAL. 2016; 12: mep_2374-8265.10355.
Full Text - Boyatzis R. Transforming qualitative information: thematic analysis and code development. Thousand Oaks: Sage Publications, Inc; 1998.
- Sox CM, Dell M, Phillipi CA, Cabral HJ, Vargas G and Lewin LO. Feedback on oral presentations during pediatric clerkships: a randomized controlled trial. Pediatrics. 2014; 134: 965-971.
Full Text PubMed - van Ginkel S, Gulikers J, Biemans H and Mulder M. The impact of the feedback source on developing oral presentation competence. Studies in Higher Education. 2017; 42: 1671-1685.
Full Text - De Grez L, Valcke M and Roozen I. How effective are self- and peer assessment of oral presentation skills compared with teachers’ assessments? Active Learning in Higher Education. 2012; 13: 129-142.
Full Text - Magin D and Helmore P. Peer and teacher assessments of oral presentation skills: how reliable are they? Studies in Higher Education. 2001; 26: 287-298.
Full Text - Wettergreen SA, Brunner J, Linnebur SA, Borgelt LM and Saseen JJ. Comparison of faculty assessment and students' self-assessment of performance during clinical case discussions in a pharmacotherapy capstone course. Med Teach. 2018; 40: 193-198.
Full Text PubMed - Maden J, Taylor M. Developing and implementing authentic oral assessment instruments. Paper presented at: The 35th Annual Meeting of Teachers of English to Speakers of Other Languages; 27 February -3 March 2001; 35th, St. Louis, MO; 2001.
- Dell M, Lewin L and Gigante J. What's the story? Expectations for oral case presentations. Pediatrics. 2012; 130: 1-4.
Full Text PubMed - Pangaro L. A new vocabulary and other innovations for improving descriptive in-training evaluations. Acad Med. 1999; 74: 1203-1207.
Full Text PubMed - Michaelsen LK and Schultheiss EE. Making feedback helpful. Journal of Management Education. 1989; 13: 109-113.
Full Text